
The average Redbridge home reached £495,977 in June, the third-biggest annual rise of all 33 London boroughs, while the capital as a whole fell. Terraces led at 4.7%.
The average home in Redbridge sold for £495,977 in June 2026, up 3.6% over the year, according to the UK House Price Index published by HM Land Registry on 19 August. In cash that is £17,076 more than the same month last year.
Over those same twelve months the London average fell 2.5%, to £553,870. England rose 1.8%, to £293,262.
That combination is what makes the figure worth reading twice. Redbridge did not simply do well. It did well while the market it sits inside went backwards.
Third of 33
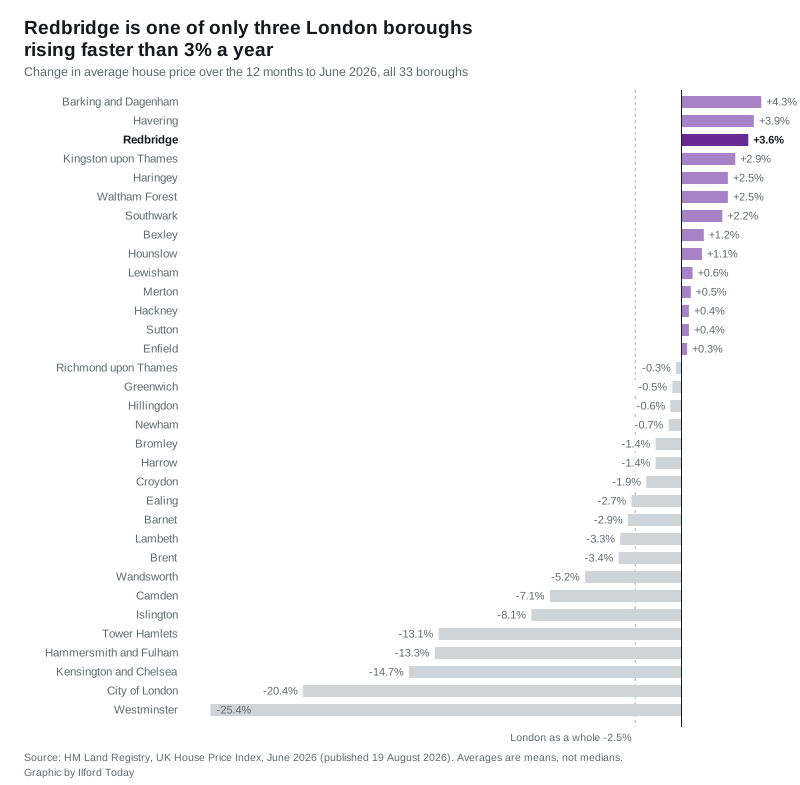
Ranked by annual change, Redbridge comes third out of all 33 London boroughs. Only two beat it:
- Barking and Dagenham, up 4.3% to £371,030
- Havering, up 3.9% to £456,759
- Redbridge, up 3.6% to £495,977
The pattern is hard to miss. The three fastest-rising boroughs in London are all in the outer north east, and all three are among the cheaper places to buy in the capital.
Nineteen of the 33 boroughs fell over the year. The steepest falls were in the expensive centre: Westminster down 25.4%, the City of London down 20.4% and Kensington and Chelsea down 14.7%.
Set against England as a whole rather than London, the borough looks far more ordinary. Redbridge ranks 123rd of the 295 English local authority districts on annual change, comfortably mid table. Sixty-two English districts fell.
The gap to London has closed by £31,000
Because Redbridge climbed while London slid, the distance between the two averages has shrunk sharply in a single year:
- June 2025: the London average was £89,149 above the Redbridge average
- June 2026: it was £57,893 above
The borough is still short of its own record. Redbridge peaked at £504,662 in September 2025, so June’s figure sits 1.7%, or £8,685, below that high. Prices also dipped 0.4% between May and June.
Terraces are pulling the average up
The rise is not spread evenly across property types. Over the year to June 2026:
- terraced houses rose 4.7%, to £549,176
- semi-detached houses rose 3.8%, to £700,446
- flats rose 2.0%, to £312,545
- detached houses rose 1.8%, to £1,123,235
Terraces and semis are the bulk of what changes hands here. Houses were 71% of everything sold in the borough over the last year, on our own reading of the individual sale records. That is why those two types set the direction of the average. The first-time buyer average in Redbridge was £427,538. For buyers who already owned a home it was £594,891.
How the neighbours did
Redbridge sits between two very different markets, and the June figures show it:
| Area | Average price | Change over the year |
|---|---|---|
| Epping Forest | £536,765 | +4.9% |
| Redbridge | £495,977 | +3.6% |
| Havering | £456,759 | +3.9% |
| Waltham Forest | £522,743 | +2.5% |
| Newham | £403,032 | -0.7% |
| London | £553,870 | -2.5% |
One number to treat with care
The index publishes sales volumes several months behind prices, so the most recent count for Redbridge is April 2026, with 92 sales. May and June are not yet published.
Those counts also carry a distortion worth naming rather than reading through. Redbridge recorded 439 sales in March 2025 and 80 in April 2025, either side of the stamp duty threshold change on 1 April 2025. The equivalent months in 2026 were 160 and 92. Comparing a 2026 month with its 2025 twin will mislead you around that date.
One further caveat, and it matters. The May 2026 average was first published as £495,947 and has since been revised up to £498,089. The index restates recent months as more sales complete, so the latest figure is always the least settled.
What it means for you
If you are selling. The borough average is a mean across everything from Loxford flats to Wanstead detached houses, so it describes almost no individual home. Use it for direction, not for pricing. The direction in Redbridge is up, and the type of home most likely to be moving is a terrace or a semi.
If you are buying. Redbridge is getting relatively more expensive compared with the rest of London, not less. The £31,000 narrowing of the gap in one year is the practical version of that. A first-time buyer here paid an average of £427,538 in June.
If you are staying put. Your home is worth roughly 3.6% more on paper than it was a year ago, but still a little below the September 2025 peak.
A note on the maths. UKHPI averages are means, not medians, so a handful of large sales pulls them upward. For the middle sale price in Ilford, Wanstead, Woodford Green, Barkingside and Hainault, see our Ilford house prices page, which is built from individual Land Registry sale records rather than the index. What gets built, and where, is tracked on our Ilford planning news page.
Sources
- UK House Price Index for June 2026, HM Land Registry, published 19 August 2026
- UK House Price Index: Redbridge, HM Land Registry
- UK HPI full data file, June 2026, HM Land Registry, used for the borough and district rankings
Have your say