
12,735 people in Redbridge claimed out-of-work benefits in August, up 350 in a month. Only 11 of London's 33 boroughs rose, and Redbridge rose the third fastest.
12,735 people in Redbridge were claiming benefits principally because they were out of work in August 2026. That is 6.0% of every resident aged 16 to 64, and it is 350 more than in July.
The figures come from the ONS labour market overview published on 15 September, read through the nomis database at borough level.
Two things make this month’s number worth stopping on. London’s claimant count fell, and Redbridge’s has now risen in four consecutive Augusts.
Only 11 of 33 boroughs went up. Redbridge went up third fastest
Across London the claimant count fell 1.0% over the year, from 350,690 in August 2025 to 347,135 in August 2026. Twenty-two of the 33 boroughs were down.
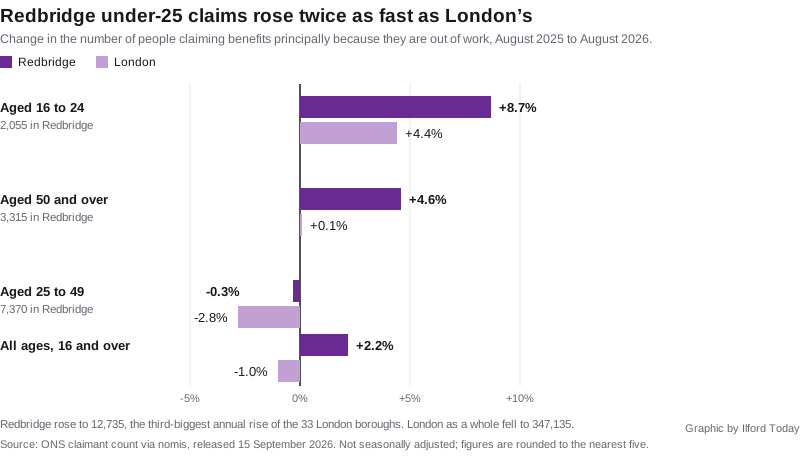
Redbridge was up 2.2%, and only two boroughs rose faster. These were the five biggest annual rises:
- Greenwich, up 3.9% to 12,200
- Sutton, up 2.3% to 4,755
- Redbridge, up 2.2% to 12,735
- Hammersmith and Fulham, up 2.2% to 6,700
- Havering, up 2.1% to 7,705
Redbridge and Hammersmith and Fulham are separated by a hundredth of a percentage point once you work from the unrounded totals.
At the other end, Islington was down 6.3%, Kensington and Chelsea down 4.9% and Newham down 4.7%.
Redbridge is not among the worst boroughs by rate. Its 6.0% of 16 to 64-year-olds puts it 13th of 33, above the London figure of 5.5% but well below Barking and Dagenham, Haringey and Newham, which are all on 7.4%. The point is the direction, not the level.
The rise is under-25s and over-50s
Split the year by age and the borough’s working-age core has barely moved. The two ends have.
- Aged 16 to 24: 2,055, up 8.7% on August 2025 (1,890). London rose 4.4%.
- Aged 50 and over: 3,315, up 4.6% on August 2025 (3,170). London rose 0.1%.
- Aged 25 to 49: 7,370, down 0.3% on August 2025 (7,395). London fell 2.8%.
The under-25 figure is the one that keeps moving. 2,055 is the highest count of 16 to 24-year-old claimants in Redbridge in any month since August 2021, when the pandemic support schemes were still unwinding and the figure was 2,075. It is more than two and a half times the 775 recorded in August 2019.
Ranked against the other boroughs, Redbridge had the sixth-fastest rise in under-25 claims in London over the year, behind the City of London, Hillingdon, Greenwich, Enfield and Bromley. Barking and Dagenham, next door, was seventh on 8.5%.
August usually goes down here. This year it went up 350
The claimant count is not seasonally adjusted, so a rise between July and August is not automatically bad news: school and college leavers enter the figures at this point in the year.
What is unusual is the size of it. Redbridge’s count went from 12,385 in July to 12,735 in August, a rise of 350. Checking every year back to 2015, that is the biggest July to August increase the borough has recorded, larger even than the 340 added in August 2020. In both 2024 and 2025 the August figure actually fell.
Set against the same month in earlier years:
| August | Claimants | Aged 16 to 24 |
|---|---|---|
| 2021 | 14,045 | 2,075 |
| 2022 | 8,985 | 1,340 |
| 2023 | 10,075 | 1,505 |
| 2024 | 12,175 | 1,650 |
| 2025 | 12,455 | 1,890 |
| 2026 | 12,735 | 2,055 |
Four consecutive years of increases, and the total is now the highest for an August since 2021.
The July figure we published has been revised
Last month we reported Redbridge’s July claimant count as 12,650. Nomis now records July 2026 as 12,385, a reduction of 265.
That is a revision, not a different measurement: the July 2025 and July 2024 figures in the same data pull are identical to the ones we published in August. The ONS explains why in its Claimant Count methodology: the Jobseeker’s Allowance part of the count is fixed three weeks after the count date, but the Universal Credit part “allows for revisions to the data for one previous month”. So the newest month in any release is the one most likely to move, and it moves by the following release.
The practical effect is that August’s 350 rise is measured from a revised July. On the figure published at the time, the month-on-month rise would have read as 85.
What it means for you
- The claimant count is not the unemployment rate. It counts people claiming Universal Credit or Jobseeker’s Allowance who are required to look for work. People who are unemployed but not claiming are not in it, and some people in work on low earnings are.
- It is a borough figure. Redbridge runs from Wanstead and South Woodford to Hainault and Goodmayes, and the strain is not spread evenly across it.
- If you are out of work, the council’s free service is Work Redbridge: qualified advisers, CV reviews, weekly work clubs, employability workshops and a fortnightly vacancy bulletin, at venues across the borough. Note the eligibility rule attached to its DWP-funded employment support: you must be over 18 and living in Redbridge, with the right to work in the UK, and not already on another DWP-funded programme. The 16 and 17-year-olds inside that 2,055 figure are outside it.
- The wider picture in the borough: the draft plan for Ilford town centre published this month proposes 1,200 new jobs by 2050, and records that 55% of people living in Ilford are economically active, below the London average.
- The next figures, covering September 2026, are due from the ONS on 20 October 2026.
Sources
- ONS claimant count by sex and age, dataset NM_162_1, via nomis, for all Redbridge and London borough figures, extracted 20 September 2026. Figures are not seasonally adjusted and are rounded to the nearest five.
- Labour market overview, UK: September 2026, Office for National Statistics, released 15 September 2026, next release 20 October 2026.
- Claimant Count Quality and Methodology Information, ONS, for the revision rule quoted above.
- Ilford Opportunity Area Planning Framework, consultation draft, September 2026, for the 1,200 jobs proposal and the economic activity rate.
- Help finding a job, Redbridge Council, for the Work Redbridge service and its eligibility criteria.
Have your say